
Our latest posts on digital
marketing.
Access to guides, case studies, webinars & more.
Develop your knowledge at your own pace with Mapp learning tools!


What really separates fashion’s winners from the rest.


Our 2025 Fashion Retail Operating Index looks at 113 quoted stocks across UK/EU/US and scores them on a size‑aware composite of growth, margin momentum and cash discipline (QH Rank).
The key takeway: The top quoted fashion retailers have grown their revenue since 2019 but profit quality and cash have declined.
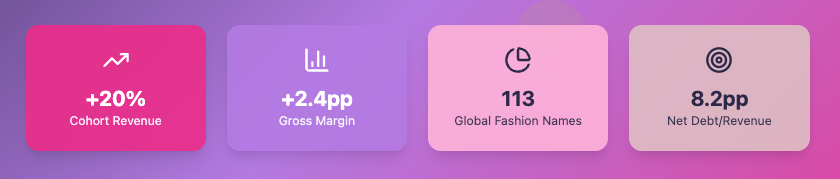
The cohort shows revenue +20% and gross margin +2.4pp, yet operating margin –2.9pp and the share of loss‑makers rising from 9.8% to 18.9%. Working‑capital cycles have lengthened and leverage has crept up. In short, for the larger operators, growth is back and it is cash velocity and balance‑sheet discipline not channel mix that separate winners from laggards.
These are relevant insights for Retailers making FY26–27 plans. There’s lots of cash left on the table across every part of the product journey. Whether it is in what to buy and how much, supply chains, substitutions, customer experience and returns. Each part of the journey presents opportunities to deliver more efficiency and maintain brand power.
A recent MIT report, “The GenAI Divide. STATE OF AI IN BUSINESS 2025” opens with “Despite $30–40 billion in enterprise investment into GenAI, this report uncovers a surprising result in that 95% of organizations are getting zero return”. Of the top 5 barriers 2 and 3 were: “Model output quality concerns” and “Poor user experience”. To me, it would be interesting to understand how much of those barriers occur due to poor quality and inconsistent data feeding those models.
Many of the areas of margin improvement, particularly with fashion retail, are perfect problems for ML or LLM models to perform well in. But, only if there is excellent quality data that is consistent throughout the business. We would argue that better product data in the language of the customer is the upstream lever that improves sell‑through, experiences, reduces returns and shortens the cash cycle.
That’s the efficiency upgrade most retailers haven’t complete – and our report is showing the urgent need to improve in this field.
We use a third party to perform the registration for our content. This third party may collect data about your activity. Please review the details and accept the service to complete the registration.
 DE
DE